
Regulatory bodies around the world require that cleanrooms meet the allowable particle counts as required per their classification. Most pharmaceutical manufacturers take a conservative approach to ensure compliance with particle count limits and often, this is based on historical data from previous projects where air change rates are set at a very high level, relative to the need.
There are many factors that contribute to varying particle counts to fluctuate between facilities, including process functions, air filtration equipment, physical design, human activity and level of gowning, surface deposition, cleaning regiment and frequency and space pressurization.
Test data for an ISO 8 cleanroom with 20 air change per hour (ACH) found that particle counts were typically below 1,000 parts per million (ppm) and peaked at 2,241 ppm, a level that is considerably below the required particle count of 100,000 ppm. Similar observations were made for ISO 7 rooms with 40 air changes per hour. Particle counts were below 1,000 ppm with an allowable particle count of 10,000 ppm. This data entices us to look deeper into the design for air changes.
Reduction of air change rates in cleanroom applications is desirable to reduce energy consumption. However, there are concerns that there is not an easy solution if particle counts are above the acceptable level. How can a facility benefit from lower air change rates without risking non-compliance — and what is the level of energy and cost savings that can be expected?
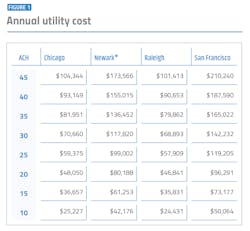
*Newark and San Francisco costs are significantly higher due to higher utility rates.
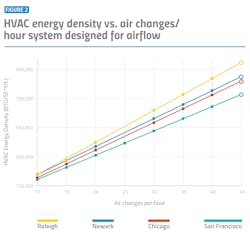
Refer to Figure 2 for energy consumption by city and air change rate.
Basis for analysis
The authors reviewed two scenarios:
- The size of an air handler for design flow rate with a 10 percent safety factor on airflow, with static pressure accounted for. This will be reviewed for design air change rates between 10 and 45 for various climate and utility base cost locations.
- The energy consumption impact of operating between 10 and 20 ACH on a system designed for 22 ACH (20 ACH plus a 10 percent design margin).
The analysis is focused on air change rates. All of the other aspects of the design remained the same, including space temperature and humidity; volume; internal heat loading; no exterior walls and fixed outdoor air volume to account for pressurization leakage and code compliance.
The cleanroom: The suite is based on a volume of 81,330 cubic feet (cu ft), with air change rates from 10 to 45 ACH. The main suite is 77,692 cu ft, and the remainder is split between four airlocks. The airlocks are supplied with five ACH greater than the process room to allow for clean-up. Internal lighting/process loading assumed at 3.07 British Thermal Unit/square foot (Btuh/sf), and 6.82 Btuh/sf respectively.
Utility generation and costs: The base analysis assumes heating hot water is generated with a natural gas steam boiler with a steam-to-hot water converter at 82 percent efficiency. This includes distribution losses and on design cooling day with adjustments made for variations in combustion air temperature throughout the year.
Using steam for a heating source is typical for GMP pharmaceutical facilities. Chilled water generation for cooling was based on a chiller plant with cooling towers. Utility and air-side equipment is compliant with ASHRAE 90.1. Trane Trace 7003 was utilized for annual energy models on an hourly basis over an entire year for each site.
Site selection: The analysis includes air change rates between 10 and 45 ACH. Four different locations were reviewed: San Francisco, Chicago, Raleigh, and Newark, New Jersey.
These sites were selected for a wide range of climatic conditions. Climate modeling data came from the National Oceanic and Atmospheric Administration. Data included average hourly data for an entire year. Utility rates were based on industrial utility rates for each location.
The findings for the analysis are shown in Figures 1 and 2.
Findings across sites
San Francisco has the lowest energy consumption, but the highest utility cost due to utility rates. Figure 2 presents a linear relationship between airflow rate and energy consumption. If a pharmaceutical manufacturer chooses to run at 20 ACH when 10 ACH is sufficient, the additional utility cost increase per year is significant, at between 84.8 and 96.7 per cent, depending on location. Typically, HVAC utility costs account for roughly 60 percent of a GMP pharmaceutical facility’s total utility cost.
Our analysis across these locations shows that while utility rates vary by location and have an impact on facilities’ energy costs, differences in ACH levels play an even more significant role and can lead to significant savings in annual costs. As HVAC utility costs account for more than half of a pharmaceutical facility’s total utility cost, careful consideration needs to be given to operating ACH rates and cost impact. Considering the potential energy savings for a single system, the site-wide energy savings when multiplied over the number of cleanroom HVAC systems that may be able to run at a lower air change rate is significant. The potential to reduce overall site utility cost is substantial.
However, designing an air handling system with the sole purpose of meeting particle limits has significant risk if the required air change rate is underestimated.
Analysis of HVAC system size
The same clean space model was used as a basis for this analysis. Raleigh was used as the sample location. The energy cost at airflows between 20 and 10 ACH was compared for two different systems:
- Air handling unit with one supply fan and one return fan designed at 22 air changes per hour (20 ACH plus 10 percent margin).
- Air handling unit sized to meet the air changes per hour with a 10 percent design margin. Pressure drops were adjusted as the square of the flow for most component, filter losses were provided by filter vendor at the varying airflows.
It was assumed that pressure drop through the venturi-valves did not change. Total system pressure reduces as the operating airflow rates are reduced, and the system becomes more oversized. Motors/variable frequency drives (VFDs) experience reduced efficiency as the load becomes smaller. As VFD/motor efficiency decreases, the system pressure drop savings offsets this inefficiency.
As the air change rate reduced from 20 to 14 ACH, the systems sized for 22 ACH shows an increasing savings over the system sized for the load due to reduced pressure drops in the system. As the system airflow drops below 14 ACH, the fan motor and VFD losses start to become significant offsetting the reduced fan load based on reduced airflows and pressure drops. Either way, the system designed for 22 ACH provides better performance at lower airflows down to 10 ACH.
Considering a fan array option, some fans can be shut down as the airflow drops, allowing the fan and VFD efficiency to be maintained, resulting in higher energy savings at the lower air change rates versus the system with a single supply and return fan.
However, this comes at the cost of lower efficiency at design conditions due to the smaller wheel diameter of the fans in the array and the generally decreasing efficiency with decreasing wheel diameter.
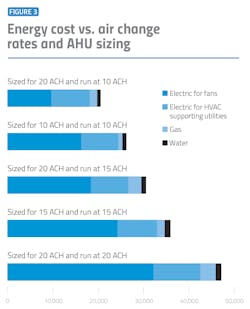
The fan power cost as a portion of overall utility cost for the cleanroom air handling system is significant, varying between 53 and 68 percent of the total system utility cost, depending on the various options reviewed. This being the case, the biggest savings at the lower air change rates is fan power.
Figure 3 provides utility cost broken down by utility with fan power separated out of HVAC utility electrical costs such as chillers, pumps, tower and boiler fans. By far the largest portion of savings is in the reduction of fan power. This demonstrates that sizing the air handling system for what is believed to be the worst case and commissioning the system to a lower airflow has merit.
Sizing in the table above does not show the added 10 percent margin to ensure the system meets the sizing airflow listed.
Based on the data, sizing an HVAC system to ensure the air change rates at design will meet the cleanroom classification requirements and then working to reduce airflow at plant start-up would be a reasonable approach. The question becomes: Are there potential issues with a system running at a lower airflow rate than designed and are there any code issues that may be a hinderance?
Portions of the system may need to be revisited from an oversizing standpoint when considering running an air handling system at a lower airflow rate. The following modifications may be needed for lower air change rates:
- Coil and humidification control valves turndown;
- Confirm venturi air valves do not fall below their minimum allowed airflows;
- Balancing valves may need to be reduced in size to get adequate velocity to allow for balancing;
- Airflow may be needed for pressurization such as bubble airlocks limiting the reduction in airflow;
- Review part load operating conditions of central utility systems.
Various energy codes make explicit restrictions on oversizing air handling systems. Examples include the International Energy Conservation Code 2015, which states: “The output capacity of the heating and cooling equipment shall be no greater than the loads calculated.” Typical HVAC systems for pharmaceutical cleanrooms use chilled water and heating hot water that are impacted by reducing the load on the systems.
Based on our analysis, systems designed for higher airflow rates, but running at lower airflow rates can generate the biggest savings for pharma facility operators. However, consideration needs to be given to all aspects of the system to ensure there are no potential design and operational issues with a system running at a lower airflow rate.
Conclusion
Energy costs associated with HVAC can account for over 60 percent of a pharma GMP facility’s energy use and cost. Large portions of this cost are from cleanroom HVAC systems. Typically, air change rates for clean spaces are based on historical data, leading to overdesign, which increases utility costs and carbon footprint.
However, using a safe but adequate airflow that allows for compliant operation, while at the same time minimizing utility cost, carbon footprint and resource waste, is beneficial for facility operators and society in general.
Oversizing an air handler and operating at a lower airflow than design saves more energy than creating and operating at a lower airflow rate while reducing the risk of being undersized to properly maintain room particle counts. Based on the analysis, energy savings can be as much as 30 percent lower with the same operating airflow.
Energy savings for multiple units add up as air change rates are reduced. Multiplying these savings across a campus will have a significant impact on site utility consumption. Sizing systems for reduced air change rate will not allow for adjustments in air changes to meet regulatory particulate requirements, if it becomes an issue.
Reduced airflow rate can delay the start-up of a facility and require significant facility modifications to correct. An alternative is to size an HVAC system to ensure compliance and then back the airflow down as the system and space classification will allow. Energy codes may not allow oversizing HVAC systems, so there is a need to communicate with the relevant authorities. With adequate information showing energy savings with an oversized system, an exception could be granted.