Data-driven quality control for vaccine production

From the onset of the COVID-19 pandemic, the race to produce a safe and effective vaccine was underway. Less than a year later, authorized vaccines began being administered and now, as of this writing, nearly 10 billion doses have been administered across 184 countries. The development, testing and production of a new vaccine happening in the span of one year is something the world had never seen, and something that could not have been possible without digital technologies.
While many organizations in the pharmaceutical world have already been making huge strides in becoming more digitized, the pandemic has certainly sped up the industry's adoption of Pharma 4.0 IIoT-enabled technologies. Some of these include automated operations, process simulation, in particular,data analytics, which allows companies to operate with more agility and improve process efficiency, capacity and product quality. And for the organizations leading the charge in mass producing something as crucial as a safe and effective COVID-19 vaccine, advanced analytics solutions are a production and quality control game-changer.
Components of vaccine quality
Meeting quality standards is important for any industry, but it’s especially critical within pharmaceuticals. When it comes to pharma manufacturing, quality refers to the quality and performance attributes of the raw material used in the production process, as well as the performance of the production line itself.
During pharmaceutical production, a Process Control System (PCS) is usually set in place in order to maintain consistent levels of quality, costs and capacity, while also ensuring worker safety. And with the right digital solutions in place, the time-series data that is being produced from sensors throughout the production line can be leveraged to improve operational performance and control product quality, as well as provide crucial quality information for each batch of the vaccine.
Additionally, it’s important to consider other factors besides production processes that could impact product quality such as equipment health, storage and shipment conditions, packaging and handling. And for each vaccine, these factors are different.
Quality assurance focuses on providing confidence that quality standards are met, as well as activities and actions to prevent quality problems. It requires systematic measurement, comparisons with known standards, monitoring of production processes and variables, and an associated feedback loop. For vaccine production, the pH, temperature and cycle time are key variables that impact quality, and the sensor-generated time-series data of these variables can be monitored.
Harnessing advanced analytics
For some time now, data scientists have used sensor-generated time-series data (optionally in combination with data from other sources) to build process monitoring models and even prediction models to solve complicated process issues. Because this work is time-consuming, analytically demanding, and requires experts in the field, only the most critical production-related problems are usually feasible.
Additionally, process and subject matter experts (SMEs) are also already using data analytics on a day-to-day basis while studying, troubleshooting and optimizing the processes. However, importing data from a few sensors, aggregating contextual information from other sources, filtering out irrelevant periods, performing mathematical manipulations, calculating correlations, etc. is an iterative process. And much like with data scientists, traditional approaches to perform analyses are time-consuming, and only the most critical problems warrant the days or even weeks a thorough exploration could potentially take. A more practical and effective approach — one that is already being utilized to optimize vaccine production — is for SMEs to harness new, innovative solutions like self-service advanced analytics.
Advanced analytics allows SMEs to quickly interpret what their time-series data is revealing about the processes at any given time. With it, data can be easily visualized, and its pattern recognition and machine learning capabilities enable users to troubleshoot process issues and optimize their operations.
Unlocking data silos
Advanced analytics takes it a step further, however, in that SMEs can also contextualize their data. All kinds of events during the production process that can impact product quality and operational performance —events such as maintenance stops, process anomalies, asset health information, external events and production losses — can be captured and recorded within the platform.
Additionally, context data can be fully leveraged. For example, within vaccine production, every batch has its own metadata, such as the batch number, cycle time, etc., which can be extended upon to include test data from the laboratory. This additional information enables a quicker assessment of the best runs, so process experts can create a “golden batch fingerprint” — a benchmark for future batches. It also collects the data of underperforming batches, which can serve as a starting point for investigative analysis as we describe in the following use case.
Troubleshooting quality issues: A case study
During the COVID-19 vaccine production process at one plant, process experts noticed a problem with the vaccine quality, so they needed to drill down into the data to investigate. The self-service analytics tool they were using offered different capabilities to view details of production trends and other derived process information, so the manufacturer took the following intuitive steps in their investigative phases to understand what factors were affecting their batches.
Phase 1: Issue assessment
First, the team started by looking at the trends on their custom production dashboard and saw that the cycle time of a recent batch was much longer than normal. Looking at the box-plot tile within their dashboard, they determined that some of the process phases had a higher variation than others.
Next, they looked at the monitor and “current value” tiles to see how the process had been behaving at current points in time and saw that overall, it seemed to be within the expected control parameters. Finally, they zoomed into a tile in the dashboard containing contextual process information to view specific events in order to determine the root cause for the low-quality material. They noticed that there were different events occurring throughout the process, but in this investigation, they were only interested in the low quality "failed batch" events.
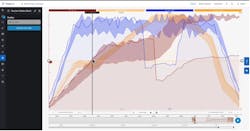
The shaded hull regions are from a fingerprint that was produced using the golden batches. The solid red, blue, and orange lines represent the bad batches which clearly drift outside the hull regions established by the golden fingerprint. Image courtesy of TrendMiner.
Phase 2: Root cause analysis
In the next investigative phase, the process experts needed to view the “failed batch” events to find the root cause of the low quality. Knowing that pH is a major driving factor in final quality numbers, they started their investigation looking at this parameter. They used a feature of the self-service analytics tool that uses machine learning to generate recommended solutions/answers to process questions and saw that a drop in temperature seemed to be causing a drop in pH. They therefore hypothesized that this was likely the root cause of low-quality product.
Phase 3: Proactive measures
Finally, they compared a failed batch against a set of previously approved batches (which had been saved as a “golden fingerprint”) to see where the process may have deviated. They could quickly see that first the temperature dropped out of threshold, which was then followed by a drop in the pH out of threshold. These findings supported their hypothesis.
In order to detect future deviations from their ideal batch thresholds, the team created a monitor that could be used with the golden batch fingerprint. If a deviation is detected, the self-service analytics tool will send an automated email alert to process personnel, notifying them of the potential quality problem, even early on during the batch production.
The availability of IIoT-enabled technology adds a level of insight to operations unlike anything seen before. Empowered with self-service advanced analytics, process experts behind COVID-19 vaccine production can now ensure data-driven quality control and optimal production processing. Additionally, production losses can be reduced and time-consuming setbacks along the production line can be avoided. And when that production line happens to consist of a vaccination that can help us return to some sense of normalcy, time is of the essence.