
Digitization offers the promise to connect everything on the plant floor. The emerging smart, connected plant will have an immense impact on production efficiency, but will also bring challenges. These include storing, capturing, contextualizing,
visualizing and analyzing the tremendous volumes of data. Without appropriate contextualization, visualization and analysis, it would be very difficult indeed for employees to make sense of that data and use it in applications to improve quality, prevent abnormal behavior, and/or manage assets better.
Manufacturers often struggle with leveraging the massive amounts of production data they collect to improve production efficiencies. This is particularly true in the data-intensive pharmaceutical and biotech industries. As we’ll see, the right data infrastructure and analytics tools made it easier for Bristol-Myers Squibb to discover data patterns, compare different batches during process development, and scale up operations.

As a leading global biopharmaceutical company, BMS’ mission is to discover and develop transformational medicines to help patients overcome diseases. One of the company’s goals is to produce clinical and economic benefits through medicines that improve patient lives. A big part of this involves applying “scientific rigor in everything they do” — including finding and using data to improve process knowledge, which therefore improves product quality and process efficiencies.
Applying Scientific Rigor to Medicine Production
To achieve the company’s goals, BMS needed to give its scientists and engineers a technology to make it easier to find and analyze the right data. Dr. Robert Forest, development engineer with BMS, chose to leverage OSIsoft PI System data using Seeq Corp.’s applications to obtain tangible business benefits for the company.
“We collect an enormous amount of data in our plants across the globe, and use PI AF [Asset Framework] and EF [Event Framework] to organize this data and provide context,” said Forest.
To leverage the PI data easily, BMS turned to Seeq tools, which Forest says “enable us to quickly search through our data, find patterns, and do analysis on our data.”
The tools enabled BMS to improve productivity, scale up processes faster from clinical to manufacturing, improve product quality, and optimize production.

Scale Up and Tech Transfer Challenges
The goal of BMS’ scale up group is to develop robust and efficient processes for molecules in the company’s development pipeline and — if the molecule is successful in clinical trials — transfer these processes to commercial manufacturing. A big part of developing these processes involves capturing and analyzing data to generate adequate process knowledge to support both technology transfer and regulatory filings.
Data is captured at a wide variety of scales. These range from experiments executed on bench top lab reactors (at the gram scale) to generating hundreds of kilos of product in large-scale equipment for clinical supplies. Due to the nature of the work, the company has unique challenges around data collection. The group works with a large number of molecules from within its portfolio. The process employed to make each molecule can vary quite a bit, with many different unit operations employed to make different molecules.
BMS routinely works to improve the processes it uses to make these molecules. As a result, whenever a campaign is executed to make a particular molecule in its large-scale equipment, the group may have only limited on-scale experience for that process. Whenever it runs large-scale batches, the company wants to make sure it has as much data as possible to generate a complete understanding of the scale-up process. Large amounts of data are generated during scale up, but assembling the data is time consuming. This often hampers data sharing and reuse and collaboration.
In its pilot plants, the company’s control systems execute the batch recipes. These systems provide batch data and S88-related context to the OSIsoft PI System. BMS users can access and visualize the needed information using its various PI tools.
Filter Dryer Use Case
When drying different products, it is important to understand the impact of various parameters on drying time to be able to identify the optimum end-point. According to Forest, a fundamental question that needs to be answered when developing specifications for a drying process is: “How long should we dry the wet cake to meet our drying endpoint?” If the product is dried for too long, it increases cycle times unnecessarily. But if the product is not dried long enough, it could fail the process control sample, which is a waste of analytic resources.
Prior to using Seeq, BMS collected many different data points from the PI tag data, using a simple summary of the statistics to help determine drying times. The company would review the minimum, maximum, and average product temperatures; agitator speed; jacket temperature; and drying time, and compare these data to the actual solvent loss measured by taking samples throughout the drying process. Manually collecting the data can be tedious, time-consuming, and error-prone — even for a fairly simple process. BMS needed a more automated way to collect these data.
Finding Data for Each Drying Stage
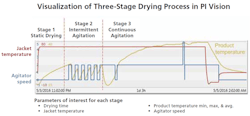
The typical filter drying process goes through three distinct drying process stages (shown above). Each phase depends upon what the agitator is doing. Stage one (static drying) starts out by heating without agitation. Stage two continues to heat, but with intermittent agitation. In stage three drying, heating continues with continuous agitation.
BMS wanted to identify some of the key parameters for each drying stage to optimize it for a range of batches. To do this, the company needed to automatically find when the dryer was operating using PI System data by associating the drying phase with the drying time, jacket temperature, product temperature (maximum, mini-mum, and average), and agitator speed.
Summary Data for Each Drying Phase
The next step was to separate the operations data by the distinct drying stages. For stage one, where there is no agitation, the Seeq tools were used to find the needed data by simply searching for periods of time when the agitator was turned off for extended time periods (rather than intermittently) and combining these data with search results with a high jacket temperature (to indicate that the dryer was operating).
To find the summary data for stage three, the search was set up to first find those periods of time when the agitator was turned on for an extended period of time, and then combine these with high jacket temperatures.
Identifying the parameters for stage two was a little trickier because the agitator is turned on and off intermittently, so there is no constant signal value upon which to base the search. To find stage two data, BMS uses Seeq’s pattern searching capability to find selected time periods to automatically find all batches in which stage two agitator on/off behavior is displayed. Seeq enables BMS to create a pattern search for the square waveform of the agitator intermittently cycling on and off. This pattern search allows the user to specify a similarity heuristic to hone the search results. Users are also able to combine the pattern search results with the jacket temperature. With the combined results, they could exclude periods of time before the drying actually started, i.e., stage two.
Seeq enabled Forest’s team at BMS to separate the data into all three stages and automatically calculate needed statistics on the PI data.
According to Forest, the ability to search by specific data and overlay batches reduced the time needed to collect the data and saved an average of one hour of analysis time per batch.
Recommendations
Using an open data architecture and the right tools to connect, store, explore and discover the right data can quickly impact productivity and the bottom line. A few specific recommendations for manufacturers follow:
- Find appropriate tools for each environment that empowers workers to access, find, discover and obtain intelligence for faster process decision-making such as temperature time for product dryers.
- Use tools that connect to the data quickly and can be used for scale up and tech transfer to manufacturing.
- Roll results out across the organization to improve efficiencies for those assets.
[javascriptSnippet]