Benchmarking Biopharma's Carbon Footprint

All across our industry, healthcare organizations are implementing sustainability activities as a positive and visible aspect of their corporate responsibility goals. In the case of GlaxoSmithKline (GSK), the goals are ambitious. GSK envisions a carbon neutral value chain by 2050, aiming for sustainable water use, and waste reduction and recycling.
GSK VISION
GSK’s efforts can be an inspiration to other companies looking for a starting point for their own environmental sustainability efforts. While GSK had developed carbon footprint models for small molecule products in other business units, the biopharmaceutical business unit within its R&D organization began a pursuit to understand the environmental impact of monoclonal antibody and therapeutic protein production in order to better inform their efforts toward the achievement of the GSK Vision for Environmental Sustainability.
The intention was to establish a baseline value for carbon emissions contributions in the biopharma area, and identify process or operational modifications that could effectively reduce that value in future processes and products. This article examines the GSK BPDS (biopharmaceutical product development & supply) team’s efforts to identify where, in the biopharmaceutical manufacturing process and product value chain, the largest contributors to carbon emissions and water usage exist. It is hoped that the conclusions uncovered may help biopharmaceutical companies focus on specific opportunities for carbon footprint reduction more quickly.
WHAT IS THE “CARBON FOOTPRINT?”
Let us step back for a moment. How is the term “carbon footprint” defined? The metric “carbon footprint” was first discussed around 2000 and has gained popularity in recent years. This designation refers to the amount of carbon dioxide and carbon equivalents emitted due to the consumption of materials and the use of energy by a particular person, group, entity or system. Carbon footprint is included as one of three primary sustainability targets for GSK’s long-term goals, along with waste/recycling and water. For the purpose and execution of this study, the carbon footprint is totalized from raw materials and component use, electricity and fuel consumption.
OVERVIEW OF RESULTS
The years-long effort was a painstaking process that resulted in the development of a rigorous model to examine primary and secondary manufacturing across three products in the biopharma space. The results were somewhat unexpected.
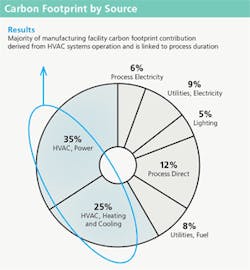
The team found that direct energy usage in the manufacturing facility is the number one carbon footprint contributor, and that facility HVAC operation associated with maintaining a clean, GMP environment was the single, largest source of carbon emissions or equivalents; factors like raw materials and transportation - even the process itself - were small by comparison.
Thus, optimizing the facility is key for overall carbon footprint reduction. GSK, as a result of this benchmarking project, is not only focusing on efficiency opportunities in the facility, but also on process and technology advancements that result in time-inplant reductions.
Counter intuitive perhaps is the establishment of data indicating that the direct process unit operations, materials and components are minimally impactful to carbon footprint. However, good design has always meant a focus on batch productivity, including improved process titers; this effort simply confirmed that “good design” is the same as sustainable design and that efforts to focus on shortening process time, along with improving titer and therefore batch productivity, will also decrease the carbon footprint of a product per unit produced.
The original goal for developing a normalized baseline average for carbon emissions - 13 kg CO2e per dose - was established across both primary and secondary manufacturing.
HOW GSK IDENTIFIED THE RELEVANT CARBON FOOTPRINT
WHERE WAS THE FOCUS?
The BPDS team effort and evaluation were conducted across two main biopharm process platforms (mammalian cell culture MCC, and microbial fermentation, MF) at the commercial manufacturing scale. Three products, referred to as MF Process 1 and MCC Process 1 & 2, were evaluated.
The study analyzed the carbon footprint of the products as they are manufactured today and then against a series of proposed modifications. After the manufacturing process model was finished, sensitivity analyses were conducted to determine the impact of specific advanced manufacturing technologies on the operations and on their respective footprints.
These studies were run using the Carbon Trust Footprint Expert tool that was developed by the Carbon Trust organization. This model was leveraged and validated against biopharmaceutical process specifics.
MODELS
The carbon footprint models included all major direct and indirect energy users associated with manufacturing, such as HVAC, process utilities and any other equipment or load that would be reflected on a facility energy bill related to manufacturing. Models also include raw materials, disposable components, waste and transportation. Each of these components was modeled using emissions factors provided either from the Carbon Trust’s Footprint Reference Expert Reference Database 3.2, or from a GSK database.
Two modeling approaches were used in this study, with regards to evaluating the energy component: “bottom-up” and “top-down.” Bottom-up refers to models where detailed data and assumptions about plant operations (such as steam flow rate to a bioreactor, or air change rate in a clean room) were used to calculate the energy used by each system and in each unit operation. Top-down models use an energy bill over the course of a longer period of time (for instance a year), and batch duration (time in-plant) data during that time interval, to determine total energy consumption for a batch.
The bottom-up method gives the model substantial flexibility to generate accurate sensitivity analyses and understand how any facility parameters can affect footprint. It can also miss important components of energy consumption if sufficient calibration data are not available. Therefore, wherever available, the total carbon footprint was calculated from energy usage data in top-down approach. Separate, bottom-up analyses were used to generate sensitivity analyses and further granularity in data (specifically, emissions by unit operation and by source).

MICROBIAL & MAMMALIAN CELL CULTURE CARBON FOOTPRINTS: A COMPARISON
This comparison of microbial and mammalian cell processes revealed that fermentation titer and batch productivity dramatically affect the carbon footprint on a per unit basis. The higher the titer the broader the distribution of carbon emissions.
The study found that there is a significant difference in carbon footprint between mammalian and microbial processes due to overall time-in-plant and batch productivity. The microbial manufacturing process duration studied has 60 percent less time-in-plant when compared with the mammalian processes, which resulted in a much lower per-dose carbon footprint for the microbial process. The high batch productivity from the microbial process compounded this effect.
CONTEXTUALIZING RESULTS
It is interesting to have a context for the footprint of commonly used goods and services to compare against these results.
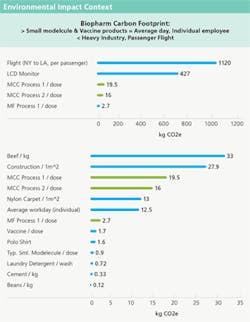
The Environmental Impact Context graphs on the next page compare the three commercial scale products examined in this study with typical Vaccine and Small Molecule products, show a significantly higher kg CO2 per unit for the microbial and mammalian processes. However, an average individual, in an average workday, shows a comparable carbon footprint effect. For comparison’s sake, the high carbon effect of the construction industry is also shown with various other everyday goods.
Note that the biopharm process is much less carbon-intensive than activities like remodeling a room in the home, taking a transcontinental flight, heating or cooling a home or manufacturing an electronic device.
RESULTS ANALYSIS
The carbon footprint reduction realized by energy efficient HVAC systems and utilities should not be underestimated, as noted in GSK’s recent study.
As shown in the Figure 1 chart, process and utilities electricity, lighting, direct process, fuel and HVAC contributions were broken out and evaluated. The majority of manufacturing facility contributions are linked to HVAC system operation, which is directly related to maintenance of the classified spaces required for biopharmaceutical manufacturing activities.SENSITIVITY ANALYSES
With the baseline carbon footprint established at 13 kg CO2e per dose of biopharmaceutical drug product and the identification of major areas of focus for carbon emissions reduction completed, the GSK team went further and tested the impact of making changes to the process on carbon footprint.
These sensitivity analyses, including titer increases, single-use technology, reusable filters, room air change rate reductions (moving from classified space to controlled not classified), utility upgrades (combined heat and power generation), and blow-fill-seal techniques (toward a goal of closing the secondary manufacturing process), were also among the various modifications tested.
Summarizing the sensitivity analysis conclusions is simple. Where the process can be closed, close it. Where process steps can be removed, remove them. Where productivity improvements can be made, make them. When time-in-plant can be shortened, shorten it. Good design practices lead to more productive production and are more sustainable.
AN INDUSTRY JOURNEY
To substantially reduce carbon footprint, it is necessary to target areas that have the highest impact. It can be concluded that for the present state of biopharmaceutical manufacturing, the primary carbon contributions are from the manufacturing facilities and should be a primary area of focus for carbon footprint reduction. Carbon contribution from material inputs, packaging, labeling and transportation are minor in comparison. Energy-efficient design and operation of the facilities, especially the facilities’ HVAC systems, plant utilities and process utilities, should be thoroughly evaluated when attempting to reduce greenhouse emissions associated with biological products.
This information indicated that carbon footprint reduction techniques can be implemented for new and existing products in order to lower the carbon footprint and achieve improved sustainability. In addition to reducing carbon footprint, each of the carbon reducing strategies is tied to facility productivity or energy consumption, and therefore also have implications for cost saving and payback.
This study led to a better understanding of the drivers of the current carbon footprint inside the GSK biopharmaceutical manufacturing processes. The hope is that the results will be inspirational to other companies, forging a straightforward path to what can often seem like an overwhelming task. Continued modeling, data gathering and implementation will be ongoing for GSK, enabling the company to achieve its corporate vision of carbon neutrality by 2050. The industry now has a more finely tuned approach to focus on biomanufacturing carbon emission reduction.