Value from data: The key to digitization success

The pharmaceutical industry is in the midst of an evolution, spurred by significant reductions
in time-to-market requirements, most notably as demonstrated with COVID-19 vaccines. A key facilitator in this evolution is the ability to access, understand and use data to make better decisions more quickly. Intelligent use of data is also establishing the foundation for knowledge management capabilities for process operation and optimization, a key facet of digitization.
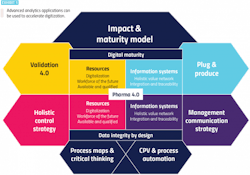
The ultimate goal is empowering digitally connected workers with easy access to data of interest so they can create insights — rather than burying them with often irrelevant papers, procedures and reports. Along these lines, the International Society of Pharmaceutical Engineering’s Pharma 4.0 has identified several key components to facilitate the digitization of the life sciences industry (Exhibit 1).
Achieving this goal is becoming more difficult because, as with all process industries, more data is being generated in the pharma industry than ever before. This is true for all aspects of the product life cycle, starting with process development, moving to pilot plants, and culminating with commercial manufacturing.
Data collection is changing rapidly as more sensors are added, both wired and wireless. Many of these sensors are no longer connected to control systems, but instead send their readings directly to asset management and other platforms, both on premise and in the cloud.
Value lies within this data, waiting to be unearthed, but challenges must be overcome.
Disparate data
In almost all situations, data is collected across many process steps, and in-process trains and lines located at multiple facilities. A holistic view of all this data is needed, along with the ability to collaborate among different departments and companies, wherever they may be located.
Collaboration is becoming even more important due to outsourcing of development and manufacturing to outside contractors. Outsourcing can speed time-to-market and reduce costs, but it introduces issues related to data access, regulatory compliance and security.
Data is typically stored in different formats, for example, time-series data and point data in laboratory information systems. Additionally, data is often stored in silos, such as paper records, process historians and control system data servers.
More recently, data is being stored in cloud platforms, like Microsoft Azure and AWS.
Creating insights
These and other issues related to extracting value from data can be addressed by providing access to all data via an advanced analytics application. This access should not require programming or other data science expertise, but it should instead empower subject matter experts (SMEs) to interact directly with data of interest. SMEs can use their process knowledge to cleanse the data, establish the proper context and create insights.
For example, data cleansing removes outliers while keeping points of interest, but it is a tedious step using traditional general-purpose tools, such as spreadsheets. Advanced analytics software speeds this step by providing tools designed specifically for cleansing process data.
Furthermore, cleansed data must be given context to establish proper relationships among data points of interest within defined time periods. For example, a signal from a pump indicating zero outlet pressure would be very significant during a continuous process where it is expected to be on, but not important during a batch process where the pump is idle because it has just been shut off after filling a tank. This is a simple example, but it is virtually impossible to establish context among all data points without deep knowledge of the manufacturing processes.
After data is cleansed and given context, insights can be created. This is typically an iterative process, with different scenarios used to hone in on the problem and its solution. Once again, SME domain knowledge is critical as this expertise speeds time to insight.
Finally, when insight is gained, it typically needs to be shared with others in the organization. The right software will make this task quick and easy while providing the capability to drill down and ascertain the steps taken to create the insight.
The following examples illustrate how advanced analytics software can be used to create insights.
Quality by design
To address this and other issues, quality by design (QbD) can be used to change the definition of the process parameters that define a quality batch. This methodology considers multiple variables and their interactions. It utilizes experimental models to broaden the range of a single variable, but only if all other parameters are within range. For example, a temperature deviation of five degrees might be acceptable for quality purposes if the other variables are within specified ranges. QbD, therefore, expands the process design space to reduce the number of major or critical deviations.
As a pharma product is commercialized, the process is transferred from process development (PD) to pilot plant, and later to commercial production plants. Typically, this results in the loss of significant information related to the design due to different equipment and personnel.
A major pharma manufacturer needed to improve its QbD modeling process used in PD to avoid failed batches and deviations in production. It also wanted to maintain the transfer of QbD information when moving from development to production.
Using an advanced analytics application for process manufacturing data, the pharma company’s SMEs analyzed a continuous drug product wet granulation step using the design of experiments strategies to determine a multivariate QbD process model. The goal was to apply the multivariate design space to commercial production for process monitoring and identification of deviations.
The experimental data was ‘time- warped’ to align the signals based on their sensor location in the continuous process. The data was then cleansed to model only steady-state operation. The design space model was built using a prediction tool for critical quality attributes, and then applied to commercial production, creating a multivariate boundary for continuous process monitoring.
The company was able to transfer the complete process design information for use in commercial production. This QbD approach resulted in expanded multivariate design space with minimized quality deviations, creating cost savings. The company also used an online multivariate design space model to automatically flag quality deviations, enabling a fast response to potential problems.
Secure data sharing
Another pharma market development is the significant increase in outsourcing of clinical and commercial manufacturing to contract manufacturing organizations (CMOs). A major challenge with outsourcing manufacturing is data access. While the CMO is responsible to the client to meet the guidelines of the outsourcing agreement, the client ultimately has their brand and name on the final product, leaving them liable for any manufacturing quality issues.
To mitigate this risk, the client often requires exports of the raw manufacturing data to prove that all critical process parameters (CPPs) were within the registered ranges for each batch. In an ideal world, the CMO data for a particular client would automatically be transferred securely into the client’s system, including context to the data within a specified latency period as defined by the CMO-client relationship.
But to share data in this manner, the CMO needs to collate data from multiple systems: time-series process data tags, lab results, calibration, maintenance, raw material information, orders, lot numbers and more. Within each of those systems, the CMO must isolate the data being provided to the client to only that which represents the client’s campaign, ensuring information from other clients is removed. Due to these and other issues, sharing data with clients often requires the CMO to perform manual and time-consuming work, resulting in data transfer in days or weeks.
On the client-side, multiple spreadsheets of data are often received from CMOs, making it difficult to aggregate among the various data sources to visualize, perform analytics and confirm results. These types of delays, coupled with slow data transfer, meaning the client has low visibility into the process in real-time, limiting or eliminating their ability to make process improvements between batches.
Advanced analytics applications facilitate data collection by using a visual approach for connecting to disparate data sources, and by automatically aligning data based on time. From there, the data can be modeled and organized to provide the desired data set to the client.
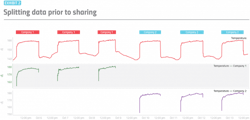
For example, if a temperature signal and associated capsules represent when batches were run for each client, the signal can be split into two separate signals representing only the data for each client (Exhibit 2).
From this point, there are three common methods of sharing the data:
- utilizing integrated security to provide controlled access,
- moving the data between CMO and client servers, or
- exporting cleansed data to Excel for sharing.
Each of these methods can be used to securely share not only data, but also insights, between a CMO and its client. The first option is the preferred approach, for reasons explained below.
New, integrated security features can limit user access control for entire data sources, workbooks or even down to the item level on a user or group basis. This gives CMOs the ability to provide selective access.
For example, a user from Company 1 logged in to see the same analysis shown in Exhibit 2 would only have access to the data for their company. From there, the client’s SMEs could perform analytics or export the data.
In addition to aggregating and isolating the data, one major advantage of using an advanced analytics application to share data between companies is the ability to share much more than just the raw data. The CMO and its client are often performing the same analytics on the data, for example, to determine whether the CPPs remained in the registered ranges. Thus, both companies could save time and energy by sharing analytics and discoveries.
Data access by SMEs to create insights, along with sharing of results, are key pillars of any digitalization strategy. Advanced analytics solutions designed specifically for process industry applications provide the tools to perform these tasks much more quickly and easily as compared to general-purpose platforms, such as spreadsheets.
As the above examples illustrate, putting advanced analytics in the hands of SMEs cuts cost, speeds time-to-market and results in other operational improvements.