Analytical Advances for Pharmaceutical Manufacturing: More information in Less Time
The cost and speed of analysis as well as the amount of information obtained must be balanced to be as cost and time efficient as possible. In addition, one has to work within the constraints imposed by regulating agencies. This often defines what testing is required and what information must be obtained.
Recent advances in analytical instruments have led to the development of techniques that allow us to increase the speed and amount of information collected on pharmaceutical samples. This has come from a couple of recent developments: first, the development of instruments able to do quantitatively measure the heat flow of samples at high scanning rates in heating and cooling. The development of high speed differential scanning calorimetric (DSC) techniques allows the detection of weak transitions to much lower levels than previously possible, allowing the determination of amorphous content to very low levels. In addition, these techniques allow the use of smaller sample sizes and much higher through-put.
Fast Scanning Rate DSC: More Information Available Faster.
Originally developed to study polymer crystallization, Fast Scanning Rate DSC has become a powerful tool in pharmaceutical studies. One of its advantages is scanning at rates from 200 to 750 degrees C per minute dramatically shortens the run time for pharmaceuticals and allow for an immense increase in the number of samples run during a shift. At 200 per minute, an auto-sampler equipped DSC can run over 275 samples in a 24 hour period. This speed of analysis allows very close monitoring of processes.
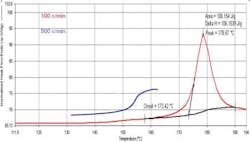
However, the real advantages of fast scanning rate DSC are found in the increase in apparent sensitivity and the suppression of kinetic events due to the increased heating rate. In excipients like lactose [1], in pure or high concentration protein formulations [2], or in crystalline pharmaceuticals, [3] the ability to detect low levels of amorphous materials and to characterize its glass transition is greatly enhanced by scanning at faster rates. One use of this is in screening for solubility studies [4]. Figure 1 shows a material run to detect the presence of amorphous components which could adversely affect dissolution of the material. Scanning at 500 degrees a minute shows a distinct glass transition, which indicates amorphous material in the sample. Similar work on lactose has shown it possible to detect the presence of amorphous lactose down to fractions of a percent.
The difference in scanning rates on the visibility of transitions is shown above. At 100 C/min the Tg blends into the leading edge of the melt. At 500 C/min, it becomes a clearly detectable Tg.
Other applications of fast scanning rate DSC exploit the time dependence of kinetic events: scanning at high rates will allow one to determine the melting point and the heat capacity of materials that normally decompose on melting. Similarly, kinetic transformations like polymorphic conversions can be “trapped” so that the original concentration of the components can be measured. This allows one to be sure that the final material processed is what it should be without needing to wait for results from slower methods.
Evolved Gas Analysis: Knowing Exactly What Comes Off.
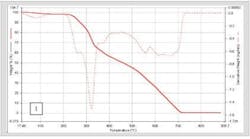
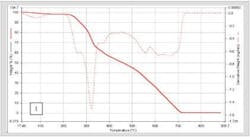
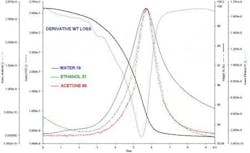
Thermogravimetric Analysis (TGA) is commonly performed to check on samples to confirm the presence of residual solvents [1]. However, TGA alone has a major disadvantage; the technique only tells you how much you have, not what it is. This lack of information is addressed by coupling the TGA to another instrument, which can identify specific compounds. Most commonly used are FTIR and MS, although recently the addition of a gas chromatograph between the TGA and the MS has been found to allow very precise identification of the volatile. All of these techniques are referred to collectively as Evolved Gas Analysis, or EVA. Individually, the abbreviations of TG-IR, TG-MS and TG-GC/MS are used. Often the TGA is replaced with a combined Differential Thermal (DT) analyzer and Thermogravimetric (TGA) analyzer. This DT/TGA, or STA (simultaneous analyzer), allows you to get thermal transitions along with the weight loss curve. Figure 3 shows data from a STA coupled to an FTIR. TG-IR with either TGA or STA is increasing commonly used for these applications. We can see the DT/TGA data gives us both the delta temperature curve and the material’s weight loss, while the IR information allows us to assign specific spectra to the various thermal events. In the case of a pharmaceutical, we would be able to look at a weight loss and confirm if it is water, acetone or benzene being evolved [5].Spectral DSC: Getting the Best of Both Worlds.
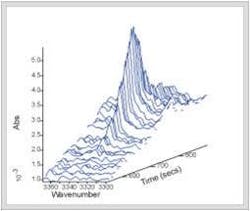
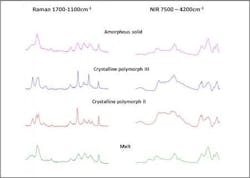
As discussed above, DSC is a powerful technique for studying transitions in materials from polymers to foods to pharmaceuticals, but the information is often incomplete in that structural or chemical information is inferred from the thermogram. For example, DSC allows users to see the transitions between crystalline forms in a drug or a food, but the forms must be determined by another method. Similarly, DSC can provide the energy and temperature of a change that occurs by either heating or photo-initiation, but other information, such as the specific chemistry of a particular part of the molecule must be inferred. Contra wise in Raman spectroscopy, it is easy to track a band associated with a specific bond, such as the sulfur bond in an ring system, but changes in the amorphous material from rigid to mobile, the glass transition, can be difficult to see. A simultaneous technique like DSC-NIR (near-infrared) or DSC-Raman solves these problems. Raman is often preferred for this coupling as it contains greater structural information [7] (Figure 4).Conclusions
Recent advances in analytical techniques allow pharmaceutical manufacturers methods to have greater control and understanding of their processes. More information can now be obtained in less time and often at lower cost.
About the Author
Kevin P. Menard, PhD, MBA, is Business Manager in Thermal Analysis at PerkinElmer.
References
1. P. Gabbott, P. Clarke, T. Mann, P. Royall, and S. Shergill, American Laboratory, 2003, August, 26.
2. D. Katayama, J.. Carpenter, M. Manning, T. Randolph, P. Setlow, and K. Menard, J. Pharma. Sci., 97, 1011, 2008.
3. M.Hurtta and I.Pitkanen, Thermochimica Acta 2004, 419(1-2), 19-29. M. Saunders, K. Podluii, S. Shergill, G. Buckton, and P. Royall, International Journal of Pharmacetics, 2004, 274, 35
4. D. Gramaglia, B. Conway, V. Kett, R. Malcolm, and H. Batchelor, International Journal of Pharmaceutics, 2005, 301, 1-5.
5. F. Paulik, Special Trends of Thermal Analysis, J. Wiley & Sons, West Sussex, UK, 1995. T. Provder, M. Urban, and H. Barth, Hyphenated Techniques in Polymer Characterization, ACS Symposium Series, Washington D.C., 1994
6. M. Garavaglia, TG-IR Analysis of the Decomposition Products of a Drug, PerkinElmer Thermal Analysis Application Note, 74, 2005.
7. Sprunt, J.; Jayasooriya, U. Appl. Spectrosc. 1997, 51, 1410. Harju, M.; Valkenon, J.; Jaysooriya, U. Spectrochim. Acta 1997, 47A, 1395. Redman-Furey, N.; Bigalow-Kern, A.; Collins, W.; Cambron, R. Proceedings of the NATAS Conference, Albuquerque, NM, 2003; Vol 31, p 292. Alexander, R.; Menard, K.; Spragg, R.; Ye, P. Proceedings of the NATAS Conference, Atlanta, GA, 2008; Vol 36, p 131. Kauffman, J.; Batykefer, L.; Tuschel, D.; Bangalore, A. J. Pharm. Biomed. Anal., in press.
8. A. Bigalow-Kern, W. Collins, R. Cambron, and N. Redman-Furey, Journal of ASTM, July August 2005, 2 (7), 42.
