NIR Calibration Transfer
Near-infrared (NIR) spectroscopy is growing in popularity within the pharmaceutical industry, as more companies implement process analytical technologies (PAT) and apply various chemometric methods to analyze resulting data. As a result, the need for calibration transfer is also growing: for example, when networking with several NIR spectrometers in different sites; when integrating instruments from other vendors yet maintaining existing methods for the original instrument base; or when adding new methods, once they are made commercially available.
The fundamental problem of standardization is ensuring that an instrument’s response conforms to a “standard” instrument response. [1] Since the setup of a calibration model from scratch requires considerable time and expense, this article discusses alternative methods for calibration transfer that offer substantial savings in both areas.
Multivariate calibration is often a challenge to transfer, as it can be very sensitive to small variations in the wavelengths or absorbance in the spectrum. For a successful calibration transfer, two analyzers must be as identical as possible in spectral range and must operate in the same mode, such as in transmittance.
Direct Standardization is one of the best multivariate methods to determine calibration transfer. Examining the Theory Calibration transfer tries to resolve two key differences between instruments: wavelengths and absorbance scale. Typically, there are three approaches used to achieve standardization:
1) making robust calibrations, 2) adjusting calibrations, and 3) adjusting spectra.
- Approaches to instrument standardization (calibration transfer). Making robust calibrations means pooling data from several instruments of the same type, when calibrating, such that calibration transfer works without standardization. Here, spectral pretreatments are important, in case there are no differences among wavelengths. A variant to this approach is to calculate some difference in spectra from the repeats of selected samples and include these in the calibration set with a reference value of zero. This is called a repeatability file [2]. Adjusting calibrations refers to using bias/skew corrections estimated from a modest number of samples (12-15) with known reference values. The simplest method is a mean bias correction, which has to be applied for each constituent of interest in a product, although the same transfer samples can be used. If a skew adjustment is involved, it requires even more samples having reference values within a good range for each constituent. This approach performs a correction of the predicted values (i.e., in the Y-space) [3], and outlier diagnostics become unavailable afterward.To adjust spectra, one would use a Direct Standardization method. This method does not need or use reference values for transfer samples, as it corrects for differences between spectra (in the X-space) [3]. Thus, independent realistic samples can be used, and selecting those samples is an important issue [4, 5]. The advantage of adjusting spectra is that all calibrations for several constituents of a product — including outlier checks — that were already developed on one instrument become available on a second instrument.
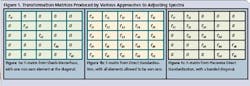
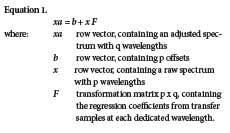
- Approaches to spectral adjustments. There are two directions for spectral adjustments [6]: Adjusting backward makes the second instrument spectra look like the ones on the first instrument, applying the existing multivariate calibration, whereas adjusting forward makes the calibration spectra from a first instrument look like the spectra on a second one, rebuilding the multivariate calibration method with known settings. Adjusting forward is the preferred option, especially when the two instruments are of different types, or when real-time prediction is applied. For this purpose, a number of identical samples (without reference values for each constituent) must be scanned on both instruments side-by-side under exactly the same conditions. Available approaches to adjusting spectra are Direct Standardization (DS), the patented Piecewise Direct Standardization (PDS) method, [7, 8] and the patented Shenk-Westerhaus method. [4, 9] The Shenk-Westerhaus method of univariate spectral adjustment method separates absorbance correction from wavelength correction. After having truncated the pairs of transfer spectra acquired from measuring 30 sealed samples [4, 5] on two different instruments, their wavelengths are matched by interpolation, [1] and the overall process is called trimming. Then a linear regression is used, one wavelength at a time (Fig. 1a), to estimate offset and slope, in order to convert spectra from one instrument to another. This approach is called univariate full-spectrum correction. DS and PDS are multivariate approaches based on linear transformation of spectra. The data from transfer samples, measured on two instruments, are used for estimating a b vector and a transformation matrix F [3, 10] that best match the pairs of spectra from transfer samples. Then, the spectra of one instrument are adjusted by adding b and multiplying by F. One key to understanding the relationship between these multivariate versions is a matrix formulation using the following equation:
When both instruments are of the same type, then p=q and F becomes a square matrix (Fig. 1b). The F-matrix is given enough flexibility to cope with wavelength shifts and multiplicative absorbance shifts simultaneously. The offset b copes with an additive absorbance shift.
The advantage is that wavelength corrections are included. Direct Standardization (DS) uses a general F-matrix with all elements allowed to be non-zero (Fig 1b). It is assumed that one of the columns of F is analogous to a standard calibration problem, so transfer samples that are scanned on both instruments can be considered the training set, and Least Square (LS), Principal Component Regression (PCR) or Partial Least Square (PLS) can be used to estimate the F-matrix.

A coefficient vector for predicting the absorbance at a given wavelength k on one instrument can be estimated from the full spectrum on the other instrument. When including many wavelengths, DS requires several constants to be estimated in F, while using a small number of factors in the regression. This can result in a risk of overfitting. However, DS corrects for the entire spectrum so that multivariate calibration models can be transferred.
It can make use of full spectral data better to represent peak broadening. The b vector in Equation 1 (above) is for background additive correction, which is the difference between the mean spectrum of one instrument and the transferred mean spectrum of the other instrument. Piecewise Direct Standardization (PDS) retains the flexibility of DS while reducing the number of constants that must be estimated; this is achieved by restricting the F-matrix to a banded matrix.
The transformation matrix F relates each adjusted absorbance to the raw absorbance at the same wavelength and to a few wavelengths beside it, in effect sliding a narrow window along the raw spectrum to pick out a small number of predictors for the equation. Thus, PDS is doing an implicit wavelength correction. Again, either PCR or PLS can be used in a local regression, with a window size to be defined, to estimate the constants for each wavelength. Because all three approaches (Shenk’s method, DS and PDS) are correcting the entire spectrum, the adjusted spectra can be further used with common full-spectrum calibration methods such as LS, PCR and PLS.
A straightforward model, rebuilt from adjusted spectra, allows interpretation of results, providing qualitative diagnostic information (y-Deviation, X-Residual, Hotelling T2 and Mahalanobis Distance). The number of transfer samples with DS and PDS can be significantly lower than with Shenk’s method, which does not take into account any relationship between wavelengths. Validation of Calibration Transfer is needed to prove that a calibration transfer has succeeded. y-Deviation is an Unscrambler-specific term that is given together with a Y-prediction value from PLS or PCR regression methods. [11, 12] It is a prediction error that expresses how safe or unsafe the Y-prediction is.
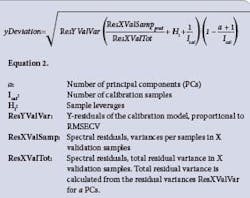
As shown in Equation 2 (above), we incorporate a number of important constants from the regression model into the calculation: distance from the model origin, number of PCs used in the calibration model, number of calibration samples (as well as the residual variances. An analysis of variance (t-Test) can be used to check if two groups of y-Deviations are significantly different or not. The same methodology can be applied to: compare y-Deviations of a test data set before and after calibration transfer in order to check if the transfer is successful; y-Deviations of two period-of-time predictions with a multivariate model to check if the model needs update. X-residual, Hotelling T2 and Mahalanobis Distance can be also used for this purpose. Public source data from IDRC Shootout 2002 [13] were used for this study. Sample sets of 615 pharmaceutical tablets were used to study the calibration transfer process.
All samples were recorded using two dispersive FossNIRsystems Multitab spectrometers in transmittance mode, in the spectral range of 600-1898 nm with an increment of 2 nm. Each tablet was subsequently sent to a laboratory for reference analyses of its strengths (API content as % HPLC assay), tablet weight, and tablet hardness. Data from each instrument have been split into a calibration set (155 spectra, CALIBRA1 and CALIBRA2), and a validation set (460 spectra, TEST1 and TEST2). The spectral region of interest for calibration transfer for the API content is 1100–1700 nm. Figure 2 (below) shows the line plots of six spectra in the calibration files from Instruments 1 and 2.
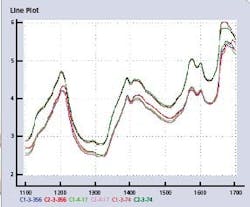
Figure 2. Six spectral line plots of three tablet pairs in CALIBRA1 and CALIBRA2, at lowest (C-3-356), median (C-4-17) and highest (C-3-74) API value.
The HPLC-reference method has an error of +/- 1.3 mg on these tablets with a target value of 200 mg API per tablet. The data set includes tablets with a wide API range between 152 to 239 mg, for developing calibration(s). No deliberate outliers are included. We performed calibration transfer using CAMO’s Accessory Pack for Spectroscopy (APS) [14], and used CAMO’s Unscrambler v9.7 to develop PLS calibration models, apply predictions and validate calibration transfer. Results before calibration transfer.
We built a quick model on CALIBRA1 absorbance data without any further transformation — a regression model with a selected wavelength range of 1100-1700 nm, keeping out six samples (19, 69, 122, 126, 127, and 129) that were mean-centered and unscaled. The RMSEC was 3.66 and the optimum number of factors (PC) was three. We used a PLS-1 regression model, built on Instrument1, to predict 460 spectra measured on both Instrument1 and Instrument2. Prediction results for same instrument data, set TEST1, were much better than TEST2 instrument data (correlation 0.948 vs. 0.884). The prediction error (RMSEP) from TEST2 predictions was more than double that of TEST1 predictions (5.081 vs. 10.583).
- Backward transfer, using the old calibration model. We selected 10 samples — #70, 105, 113, 119, 125, 129, 135, 137, 144 and 152 — to establish a transformation matrix F. In the APS software, a function called StdSelect was applied to the CALIBRA1 data set. We chose samples based on their leverage or uniqueness within the group of spectra to ensure that the transformation matrix covered all wavelength ranges of interest. Widely spanned samples were selected as transfer samples. These samples were measured on both instruments, and then the transformation matrix was calculated based on those 10 pairs of spectra using the StdGenerate function in the DS method. We applied the transformation matrix to TEST2 spectra using the StdApply function, and found that both the correlation (0.940) and the RMSEP (5.741) of predicting the transferred Instrument2 data using the Instrument1 model were similar to the TEST1 prediction. Calibration transfer can be validated by using independent samples that were not included in building the calibration model nor in the transformation pairs.
- Forward transfer, rebuilding the calibration model. The simpler, more commonly used option is to transfer Instrument2 spectra and apply the model that was built on Instrument1 data. However, for a real-time application with Instrument2, it is cumbersome to transfer each newly acquired spectrum on Instrument2 before using the model built on Instrument1.
Thus, for comparison, we applied a backward approach, transferring the Instrument1 calibration set spectra and rebuilding the calibration model for direct usage by the Instrument2 spectra. Using the same 10 sample pairs, but switching the roles of Instrument1 and Instrument2, we established a transformation matrix F by using the StdGenerate function. We then saved the new F-matrix and applied it to the CALIBRA1 spectra using the StdApply function, and built a new model using exactly the same settings as the model built without further transformation. Figure 6 (below) shows the prediction result of TEST2 using the new model. Correlation of predicted and measured values and RMSEP can be calculated when y-references are available. However, in most cases, not all y-references are available, so a tool that is independent from y-reference is required. We used the y-Deviation. One can do ANOVA using Multiple Linear Regression (MLR) to verify whether or not the y-Deviations of two instrument data predictions are significantly different. Table 1 shows the ANOVA result with the p-value from the MLR calculation.
A p-value of less than 0.05 usually indicates an effect (prediction uncertainty difference) and is declared significant (by instrument change). One can also do a t-Test in Microsoft Excel for Paired Two Samples for Means, and Paired Two Samples with Equal Variances.
About the Authors
Dongsheng Bu works at CAMO Software Inc., the company’s U.S. base in Woodbridge, N.J. Angela Schmidt is located at CAMO Software AS headquarters, in Oslo, while Suresh Kumar works in the company’s Bangalore-based unit, CAMO Software India Pvt. Ltd.
References
- Dean, T. and Isaksson, T. (1993) in: Standardization: What is it and how is it done? Part 1 and Part 2, NIR news, Vol. 4 No. 2 pp. 8–9, Vol. 4 No. 3 pp. 14–15, NIR Publications, Chisester/UK
- Shenk, J.S., Westerhaus, M.O (1991), in: Population structuring of near infrared spectra and modified partial least squares regression, Crop Science, Vol. 31, pp. 1548–1555
- Bouveresse, E., Hartmann, C, Massart, D.L., Last, I.R., Prebble, K.A. (1996) in: Standardization of Near-Infrared Spectrometric Instruments, Analytical Chemistry Vol. 68, No. 6, pp. 982–990
- Bouveresse, E., Massart, D.L., Dardenne, P. (1994) in: Calibration transfer across near-infrared spectrometric instruments using Shenk’s algorithm: effects of different standardization samples, Elsevier Analytica Chimica Acta 297, pp. 405–416
- Shenk, J.S., Westerhaus, M.O. (1995 ) in: Comparison of standardization techniques, Proceedings ICNIRS 1995 in Montreal, pp. 112–115
- Dardenne, P. (2002) in: Calibration transfer in near infrared spectroscopy, NIR news, Vol. 13 No. 4 pp 3-6, NIR Publications, Chisester/UK
- Y. Wang, B.R. Kowalski (1992) in: Calibration Transfer and Measurement Stability of Near- Infrared Spectrometers, Applied Spectroscopy, Vol. 46, 764
- PDS method, U.S. patent No. 5,459,677 (Oct.17, 1995), by Kowalski, Veltkamp and Wang
- Shenk-Westerhaus method, U.S. patent No. 4,866,644 (Sept. 12, 1989)
- Fearn, Standardization and calibration transfer for near infrared instruments: a review, J. Near Infrared Spectroscopy 9, pp. 229–244, (2001). NIR Publications, Chisester/UK
- The Unscrambler Method References, p.31
- De Vries, S., Ter Braak, C. in “Prediction Error in Partial Least Squares Regression: A Critique on the Deviation used in The Unscrambler,” Chemometrics and Intelligent Laboratory Systems, 1993, 30, pp. 239–245
- http://www.idrc-chambersburg.org/shootout_2002.htm
- http://www.camo.com/rt/Products/Unscrambler/accessory_pack.html