Supporting continued process verification

Continued process verification (CPV) was first introduced by the Food and Drug Administration (FDA) more than 10 years ago in the 2011 Process Validation Guidance and has also been adopted by other worldwide agencies through the International Council for Harmonisation (ICH) Quality Guidelines.
CPV is a mandatory requirement for pharmaceutical and other regulated industries to meet compliance for selling their products for human consumption — but CPV can also be used to provide improvements to productivity, quality and consistency of products and processes. Advanced analytics applications are a critical component for CPV implementations, ensuring compliance and facilitating process improvements.
What is CPV?
CPV is the third stage of the three-stage process validation life cycle (Exhibit 1). It is a verification of the parameters and attributes within the control strategy defined in process design (stage 1) using quality by design strategies and refined in process qualification (stage 2). The main objective of CPV is to detect and understand process variability and associated quality attributes that may not have been evident in stages 1 or 2 when the process was characterized. CPV provides a continuous verification that the control strategy and design space remain effective at maintaining product quality.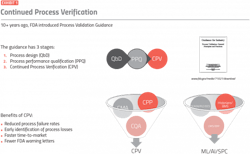
CPV requires collecting, contextualizing and analyzing data related to critical quality attributes (CQAs), critical material attributes (CMAs) and critical process parameters (CPPs) to discover and understand statistically relevant changes that become evident over time. Time periods may span several batches, campaigns, months or years — and can also be dependent on other conditions, such as what time of the year batches were run. CPV analytics must be able to detect variability within product specifications to identify problems that lead to deviations from quality standards in drug substances and products, but don’t typically lead directly to a formal out-of-specification (OOS) investigation.
CPV also can identify continuous improvement opportunities for improved process performance, reduced variability and optimized process control. Advanced analytics drives these improvements by comparing live manufacturing data to limits defined by historical data, and then by implementing appropriate response procedures for ongoing operations. Data from CPPs should be selected and contextualized to identify process behaviors of interest and to indicate when statistically meaningful variability may be impacting the process.
A compliant CPV system consists of several parts, each of which can be improved by applying advanced analytics:
- data collection
- data contextualization
- data analytics
- information sharing and reporting
Data collection
Data for CQAs, CMAs and CPPs must be collected and stored, with a significant focus on data integrity principles such as ALCOA+, where data accessibility and data availability are critical. Data must be available even though the various types of data are often stored in diverse systems optimized for their type of data.
For example, time series data for CPPs is often collected and historized in data historians. Time series data can be further contextualized with the addition of associated information from manufacturing assets, process steps and batch events. Laboratory information management systems
(LIMS) and other systems provide point data from in-process control samples taken during manufacturing or from final product CQA data tested in quality control laboratories.
CMA data are typically stored in either a LIMS database or an enterprise resource planning system, such as SAP. Manufacturing execution systems are often used to manage the execution of the manufacturing process, materials and equipment. Finally, scheduling or maintenance data can also have an impact on product quality, and these data may be stored in another system, such as enterprise resource planning. All these systems must be maintained with data integrity in mind, and with audit trails to track changes.
Data must then be accessible, meaning that a user must be able to find and retrieve the appropriate and relevant data without risking violation of data integrity. Each time the data is transferred or copied, the risk of a violation of data integrity is introduced. It is important for users
to be able to combine the data from process historians and other available systems to compare CPP, CMA and CQA data so they can effectively perform CPV on their manufacturing process. Users need to find and access the batch, sub-batch and phase of interest from the process step and unit operation, and then analyze data within that time period.
In addition to the complexity of accessing data from all the various sources while minimizing data transfer and data copies, outsourcing manufacturing steps to contract manufacturing organizations has become common in recent years. This outsourcing trend adds additional challenge to data availability and accessibility as the company developing and selling the product is responsible for certifying the manufacturing data is accurate and compliant with regulations, but it may not have direct access to the source systems. Often, only the CMO has direct access to these systems, as they own the manufacturing data.

Advanced analytics applications can access data across all these systems, without the need to copy data, which creates an additional risk to data integrity. This seamless data aggregation allows for data contextualization, analytics and reporting on top of the collected data, in a manner compliant with regulations.
Data contextualization
Data is often meaningless without the appropriate data context or metadata that explains what is occurring in the data set during a particular period. It is important to have the ability to detect the batch time frame in the time series data, but also it is often critical to identify different operations, phases and steps in the process.
Advanced analytics applications allow subject matter experts (SMEs) to add context to process data by manually entering or creating context based on information present in other databases, often by using process triggers and patterns in the data. This data context may be referred to as event frames or capsules, and it provides users of advanced analytics applications with the ability to slice and dice the time series data to identify periods of interest for CPV.

Recently, ICH Q13 was released for continuous manufacturing, which discusses the requirements for CPV in continuous pharmaceutical processes. In this method of manufacturing, batches or lots are assigned to either the quantity of input material, quantity of output material or run time of operation. This batch or lot information is context provided to the data that must be tracked through the process to determine any in-process measurements of CPPs, CQAs and CMAs relevant for each batch.
Data analytics
After the data is collected and contextualized, it is analyzed. Data analytics can comprise a wide range of possible applications, from statistics to multivariate analytics to machine learning algorithms, with various methods used to visualize results. Advanced analytic applications empower organizations to reduce variation or failure rate in the process, improve quality to reduce OOS results, quickly detect process losses and perform other tasks. These actions lead to increased availability and throughput while complying with regulatory guidance.
As an example of applying statistics, advanced analytics enable users to apply statistical process control methods on a data set to track variability and trends in the process. Typically, these analytics start from the contextualized data, with statistical analysis performed on the data for CPPs. For example, the maximum, minimum or average temperatures during a reaction phase may be tracked to control the reaction rate. Reagents or solvents may have flow rates totalized during additions to avoid over or under additions, and the duration of a drying phase may be recorded to limit decomposition or ensure proper polymorph.
From there, control charts provide visualization of the data against an average, with control limits based on standard deviations and/or normal or acceptable ranges for the parameter shown to track the control of the process from batch to batch. Run rules applied to this data set empower users to flag excursions, trending values or other anomalies in the process. Advanced analytics applications enable these calculations to be set up and tracked in near real-time, which allows organizations to detect process issues earlier and resolve poor trends before they result in product loss.
For transient portions of process data, golden profiles are a critical aspect of ensuring the process is following a particular data profile or shape. Golden profiles are statistical limits based on historical batches to alert users when the profile is different than previously observed in batches of a desired quality and yield.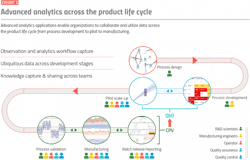
Golden profiles may be created on critical univariate signals, performed on multivariate signals using an algorithm such as principal component analysis or built on top of advanced machine learning algorithm outputs.
Golden profiles of univariate or multivariate signals are often used on critical operations or phases when the signal(s) are transient in nature and a particular profile can be used to control or improve CQAs based on historical batches or laboratory and pilot studies.
People, systems and tools
Data analysis for CPV includes a wide variety of methods for data analytics focused on ensuring the process operates consistently within a given design space, and it can also inform on potential optimization improvements within that design space. Data analytics for CPV requires the involvement of people, systems and tools, augmented by data availability and accessibility, GxP compliance and SME involvement.
Analysis of data requires GxP compliance with the entire flow of data from collection through analytics to the final result. This commonly requires validating each of the individual databases where CPP, CQA and CMA data is stored, and GxP qualification of the application performing analytics on the data. Compliance is simplified by using an advanced analytics application that accesses information from the various databases and minimizes risk by not copying or moving the data. The application should also provide an audit trail, data security and assure data integrity for all analytics it performs.
Information sharing and reporting
To realize the most value from a CPV system, the analysis must be built using expertise from SMEs across the organization, and the results must be made available throughout the organization. Process engineers monitor the process and operators run it, and other team members should be involved in creating the CPV analytics. Finally, the results should be shared throughout the organization (Exhibit 2).
For example, plant personnel needs to ensure consistent equipment operation, using methods such as condition-based monitoring or predictive maintenance models. Scheduling, plant management, executive personnel and supply chain personnel are likely very interested in tracking the progress of production, along with early detection of any issues.
Advanced analytics applications interconnect data from all steps of the manufacturing process, from process development to pilot plant to commercial manufacturing, and across the entire ecosystem from the process development and selling the company to the contract manufacturing organization (Exhibit 3).
This enables teams of users working together across these various functions to analyze the process using all available data, compare sites where similar processes are being manufactured and ensure compliance with all regulatory agency guidance. Advanced analytics applications also have a reporting or dashboarding experience for users that are focused on the big picture of whether production is on track or not. This means anyone with appropriate access can view near real-time manufacturing data, visualize the consistency of the manufacturing process and observe any supply chain impacts.
Realizing value with CPV
CPV is required for compliance and can also provide:
- reduced variation
- improved quality
- fewer out of spec results, with faster turnaround of investigations
- reduced cost
- increased throughput
- increased availability
- faster time-to-market
Historically, organizations have typically only performed CPV analytics on an annual basis due to the significant amount of effort required to analyze the disparate data sets effectively, limiting potential benefits. With advanced analytics applications, CPV can be performed in near real-time, providing the data as the batch is in progress, with immediate detection of trends or deviations. These and other benefits are a result of effective integration and digitalization of the pharmaceutical industry as it allows people and systems to seamlessly interact to increase productivity, reduce cost and maintain quality.