Blending, one of the most basic of pharmaceutical unit operations, can also be one of the most challenging to control. Solid formulations contain multiple ingredients beyond the active pharmaceutical ingredients: fillers, tabletting agents, disintegrants, and absorption enhancers or agents that slow down and control absorption. Ingredients from different vendors may behave differently due to their particle size and shape and other factors, and their tendency to form aggregates.
Materials must be chosen to ensure the desired flow characteristics, potency, proper dissolution profile, and absorption of specific formulations. Proper particle size grades of the ingredients must be selected to produce an optimum blend for capsule filling.
There are strong economic drivers for optimizing blending. Reinforcing these is the pharmaceutical quality by design (QbD) framework advanced by FDA, which requires a deeper understanding of pharmaceutical manufacturing processes, how ingredients blend and how blending progresses through different stages.
Traditionally, formulation scientists and technologists have used destructive analytical methods, such as dissolution followed by HPLC or UV, to optimize blending. This requires running the process, pulling and analyzing samples, which can lengthen the time required for development.
Recently, hyperspectral imaging (HSI) has been applied to study the behavior of solid particles in various unit processing steps as well as during multistep continuous processes. This nondestructive method generates thousands of spectra per second, providing more compositional information than conventional methods.
This article summarizes the results of blend monitoring studies using a new HSI device, in situ without stopping the blending and pulling samples. In this case, a batch-type blender was equipped with a computer controlled drive mechanism capable of imaging blending through a window mounted on the blender. The push-broom HSI camera is timed synchronously with the rotation of the blender. The hypercubes of spectral information acquired from the blend at each rotation are used to assess whether the nominal composition is achieved, to reveal uniformity of the blend to establish that the blending is properly done, and to avoid incomplete blending, large aggregates or re-aggregation.
About HSI
Hyperspectral imaging (HSI), or chemical imaging (CI), is the combination of spectroscopy and digital imaging. A hyperspectral image contains many spectra, one for each individual point on the sample’s surface. The image contains information about the spatial distribution of the materials within the sample.
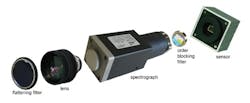
A hyperspectral camera (Figure 1) integrates an imaging spectrograph with a matrix array sensor. In these studies, we applied near infrared (NIR) spectroscopy, using NIR hyperspectral imaging to analyze the average composition, and the distribution of ingredients. Hyperspectral camera literature refers to the full 1000-2500 nm range as short-wave infrared (SWIR).
A special lens images the sample onto a slit of a transmission spectrograph. The spectrograph produces a spectrum imaged on a focal plane array detector, preserving the location of respective points on the slit and thus the points of the line on the sample.
In push-broom HSI, successive lines on the sample measured over time form a complete HS dataset. This data from a HS camera is called a “hypercube,” containing information in two spatial dimensions and one spectral dimension. The hypercube is typically ratioed with similar hypercube measurements of a highly reflective white reference material and with the residual background signal, the latter of which is measured when no light is falling on the focal plane array.
The resultant corrected spectra are produced in transmittance, reflectance, or absorbance similar to traditional spectroscopic measurements. The results can be further processed, scaled, smoothed, and eventually compressed to produce the information sought from the measurements, such as composition maps.
Push-broom Imaging
One of the significant differences between HSI and conventional single-point spectroscopy is the very large amount of data generated. Processing software and hardware are necessary to keep up with the data stream and provide compressed and processed data, thus producing composition maps and other technologically meaningful information.
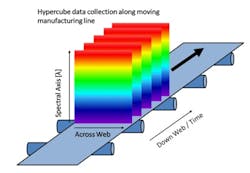
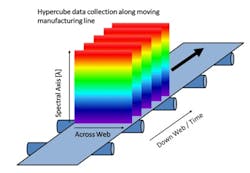
Push-broom HS cameras gather a complete spectrum of each point on one spatial line at a time [1]. The area of the object is scanned, one line at a time in rapid succession. To image the whole sample, either the sample or the camera must move. The hypercube is collected by compiling the optical data from each spatial line. Since push-broom imaging detects one line at a time, the spectral data in the hypercubes correlate with the same sample point, thus push-broom HSI cameras are used with the samples moving, which is the case in many pharmaceutical manufacturing lines, schematically shown in Figure 2.
In pharmaceutical production, there are many points where the increased amount of spectral information and the spatial information could provide additional insights, such as during transdermal manufacture, tablets, capsule filling, and blending [2-6]. For different magnifications, required by the different pharmaceutical applications, the same type of push-broom camera can be used with different optics. In this research project, for instance, a larger magnification was used to resolve the aggregates of the various pharmaceutical ingredients found in solid formulations.
imMix System
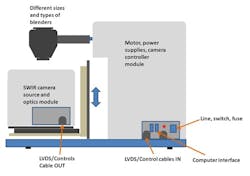
For these studies we used the inMix system, which consists of a push-broom SWIR HS camera (Specim Ltd., Oulu Finland), which is positioned to view the blend inside the rotating blender (Figure 3).
The blender is rotated by a computer-controlled motor. For the collection of HS data on all or certain specified rotations, the blender is slowed down and the camera is programmed to scan the blend covering the window. HS data collected through the optical window on the blender is turned into composition maps (indicating spatial dispersion), which are used to predict ingredients throughout the blending process. The very large amount of imaging data is condensed to a limited number of useful micromixing parameters.
The camera is protected in a stainless steel housing; the motor, power supply, and camera controller and other electronics are housed in another stainless steel module. The instrument is compatible with different sizes and different types and sizes of blenders, as the camera position is adjustable. To empty the blender, the front housing including the camera module can be easily slid out from under the blender. A white reference for background measurements and devices to establish proper focus and help measure pure components or smaller quantities of materials can be attached to the blender.
The SWIR (Short Wave Infrared) HS camera, with a wavelength range of 1000-2500 nm, is equipped with an OLES Macro SWIR HS lens (Specim Ltd., Oulu Finland), viewing approximately a 1 cm line with 30 µm optical resolution. A stationary directing mirror is used to direct the reflected light 90 degrees back to the camera lens. The blender with a window is illuminated with two quartz halogen lamps which are protected by another glass window. The height of the camera and optical parts can be adjusted. This is necessary to bring the blend into sharp focus, as well as adjusting for the differences among the different types and sizes of blenders used.
The blender, shown in Figure 4, is a one liter IBC (intermediate bulk container) blender, with filling and emptying ports, and whose emptying port is equipped with a removable 1-inch diameter sapphire observation window. The blender is attached to a rotating shaft, which is rotated by a computer-controlled motor. For frequent filling and emptying of the blender, the camera and optical parts of the blend monitor are mounted on a base plate, attached to a slide mechanism to move the entire front housing out of the way of the emptying port.
The data collection software allows the user to view live camera data, store white and dark references, and adjust camera settings such as exposure time and frame rate. The blend speed and measurement resolution can be selected, and blend rotations, where the image should be measured, can be specified.
Analysis of Hyperspectral Data
The analysis software allows the prediction of the composition of any of the ingredients for any of the blender rotations using the Science-Based Calibration (SBC) [7] or partial least squares (PLS) methods. The SBC method requires the input of the pure analytes’ spectra which can be collected with the system or imported as a single spectrum obtained from other instruments.
The large amount of HS data is automatically collected, sequentially arranged by blender rotation, and analyzed. The composition maps provide the first level of data compression, resulting in the images of the predicted compositions of each ingredient. In subsequent analysis, the images are compressed into parameters that are meaningful for the blending process and displayed as a function of the rotation of the blender.
Various image analyses can be performed with the prediction images, including standard statistical measures such as image average, standard deviation, relative standard deviation, and the fraction of pixels above/below/within a certain threshold, and spatial uniformity measures such as the distribution of aggregate sizes. The analysis software allows the prediction images for selected rotations and components to be viewed, compared, and saved.
In one blending experiment, 20% acetaminophen was blended with 39% methyl cellulose, 39% lactose, and 2% magnesium stearate. The blending was monitored at every rotation of the blender up to 200 rotations. It can be observed on Figure 5 that lactose is evenly blended by about 30 rotations of the blender, and that there is some evidence of re-agglomeration in the 80-90 rotation range. Even though there is some statistical variability from turn to turn, in this experiment, lactose seems to break up again over the consequent hundred rotations.
From the various image-processing options, the fraction of pixels that are within range of the nominal composition is shown in Figure 6, ranging from zero to one.
Each pixel is much smaller than the unit dose and is even smaller than the usual aggregate sizes, thus it is a good metric to show the progression of the blending. Of the main ingredients, cellulose and lactose reach their best uniformity at around 25 turns, whereas the acetaminophen breaks up more slowly, improving until about 160 turns in this experiment. These differences would not have been revealed using single-point near-infrared monitoring, which obtains one average spectrum for each rotation of the blender. It can also be observed that in this example the cellulose and lactose are both slowly getting less homogeneously blended, although these changes probably do not affect the quality of the blend as much as the API getting more uniformly distributed.
In another experiment, a blend containing 50% acetylsalicylic acid, 19% methyl cellulose, and 29% lactose was blended for 100 turns. The blender was stopped and 2% magnesium stearate was added and the blending continued for another 100 turns. In Fig. 7, it is seen that the addition of magnesium stearate successfully broke up the remaining aggregates, significantly lowering the median size of lactose aggregates.
A HSI camera system proved useful in monitoring the distribution and aggregate sizes of APIs and excipients in solid pharmaceutical formulations. It was also able to measure changes in the different ingredients in a 1-L test blender over the time of the blending. The results are useful for pharmaceutical formulation development for troubleshooting blending problems, qualifying the blending behavior of excipients with different compositions or different characteristics and from different sources.
References
1. Hyvärinen, T., et al. (2007). High speed hyperspectral chemical imaging.
2. Kemeny, G., et al. (2009). Hyperspectral monitoring of moving process samples. FACSS Poster.
3. Kemeny, G., et al. (2010). Hyperspectral monitoring of continuous pharmaceutical manufacturing. Transdermal Magazine.
4. Kemeny, G., et al. (2010). Pharmaceutical blend homogeneity. AAPS Poster.
5. Kemeny, G., et al. (2011). Micromixing analysis for formulation developers. AAPS Poster.
6. Ma, H. & Anderson, C. (2007). Optimisation of magnification levels for near infrared chemical imaging of blending of pharmaceutical powders. Journal of Near Infrared Spectroscopy, 15, pp. 137-151.
7. Marbach, R. (2007). Multivariate Calibration: A Science-based Method. http://www.pharmamanufacturing.com/Media/MediaManager/ralf-marbach_PATI061207.pdf
Acknowledgements
We acknowledge helpful discussions and feedback by Steve Hammond, Mojgan Moshgbar and Jun Huang of the Process Analytical Sciences Group of Pfizer, Inc.; Juan G. Osorio and Prof. Fernando J. Muzzio of Rutgers University, Department of Chemical and Biochemical Engineering; and John Bobiak of the Analytical and Bioanalytical Research and Development Group of Bristol-Myers Squibb, regarding both the hardware and software, as well as the applicability of the imMix system.
