Six Sigma, the Baxter Way

Oct. 12, 2005
Baxter Healthcare takes a unique approach to organizational excellence, treating each facility as if it were its own independent small company. Six Sigma has allowed the company to make tremendous strides in productivity. Allen Harmon, director of operations at Baxter’s Biologics facility in Hayward, Calif., explains how.
By Agnes Shanley, Editor in ChiefBaxter Healthcare is one of a handful of pharmaceutical companies that have made operational excellence part of their corporate culture. The company’s North Cove plant in North Carolina won the Bronze award in Pharmaceutical Manufacturing’s 2005 Team of the Year Award, and the first prize in ASQ’s Team Excellence awards this year.The same principles that have guided that team are also achieving results at the company’s other facilities. Six Sigma and Lean tools are helping operations staff improve efficiency and quality at Baxter’s biologicals plant in Hayward, California. At the Emerson Users’ Group meeting in October, Pharmaceutical Manufacturing caught up with Director of Operations Allen Harmon, to find out how his staff is using Lean and Six Sigma concepts to drive operational excellence at the facility.Pharmaceutical Manufacturing: What led Baxter to implement Operational Excellence programs at its Hayward facility?A.H.: Baxter already has a well-established manufacturing excellence program in place on the corporate level, and supports these efforts at each of its sites. A key business for us at Hayward is the contract manufacturing of biologicals, a market that has become increasingly competitive. When capacity was scarce, it was a seller’s market, but there’s a substantial amount of overcapacity today and cost is becoming a critical factor for sponsors, and a key determinant of whom they choose as a contract manufacturing partner.PhM: Have CMO fees dropped recently?A.H.: Some analysts predict that fees will fall by 25% or more over the next few years. And there are significant expansion plans slated by Cook Pharmacia, Cytovance, and possibly Cardinal and a company called Cobra, which plans to expand its protein manufacturing capabilities. Lower cost offshore competitors are also expected to enter the market.PhM: Has that exerted pressures on margins?A.H.: The trend is definitely being seen throughout the industry. At Baxter and Hayward, we needed a mechanism to compete more effectively in this highly competitive and volatile business environment. We needed to explore all opportunities to reduce cost and improve operating efficiencies at the site, which develops and manufactures monoclonal antibodies, therapeutic proteins and other products.PhM: How large is the Hayward facility and the company’s biologics business?A.H.: The Hayward facility employs 100 people and uses 15- to 1500-L scale bioreactors and other equipment. Baxter’s Bioscience division accounts for roughly one-third of the corporation’s business and about $3 billion in sales each year.PhM: What makes Baxter’s approach to Operational Excellence different from that of other drug companies today?A.H.: The corporation treats each facility as if it were an independent small business. Each site must develop its own five-year strategic plan, and is responsible for profit and loss. The corporate BioScience Division also provides support, offering “continuous improvement” expertise. Baxter benchmarks best practices internally, and holds annual continuous improvement forums for plant leaders.PhM: What changes in any company’s corporate culture are needed to establish a culture of operational excellence and continuous improvement?A.H.: Operational Excellence requires developing and rewarding the best operational performers in a manner that is customer-focused, fact-based, process-oriented and results-driven. The foundation for establishing this culture has already been established at Baxter, and efforts are applying these concepts at each facility.PhM: How did you approach establishing the operational excellence program at Hayward?A.H.: We took a “top down” approach, starting with strategic objectives. We then figured out what organizational structure we’d need, and did some value-stream mapping to determine the gap between where we are and where we want to be. The next step was staffing cross-functional teams with representation from key areas, including manufacturing and operations, mechanics, quality, engineering. Finally, we determined which products we needed to focus on, and used elements from Six Sigma, Kaizen and Lean to analyze where improvements could be made, and which improvements would have the most significant impact on quality. These efforts involved team members as well as Green and Black Belt specialists.PhM: What principles guided your work?A.H.: Six Sigma’s DMAIC methodology is critical. You need to define the problem in terms related to the customer, measure performance and know your data are good. You also need to analyze, to look for root causes, determine and confirm that you made the best choices and control the whole process so the problems won’t recur.DMAIC requires a hard-data-driven approach. If you can’t express what you know about any process in the form of numbers, then you don’t know much about it. And if you don’t know much about it, you can’t control it.
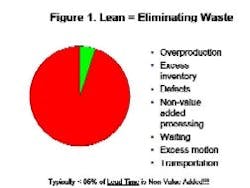
Figure 1. Click here for larger version.

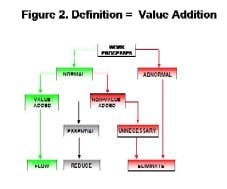
PhM: We hear of so many cases where either Six Sigma or Lean is selected to drive improvements. How do you coordinate Lean and Six Sigma efforts?A.H.: Basically you select a method based on the problem at hand. If it involves quality and variation, then Six Sigma is the tool of choice. If it involves reducing waste, then Lean is the key. But since both quality improvement and waste reduction are needed, both tools should be used.PhM: How do you determine which activities are wasteful and which processes lead to quality variations? Can you quickly walk us through the whole process?A.H.: We’ve found that, in most pharmaceutical manufacturing operations, most of the activities that go on day to day fail to add any value to final product (Figure 1, above). One of the first steps is “value stream mapping,” representing visually all activities and processes required to make the product, to define which activities actually add value, which are necessary but don’t add value, and which aren’t necessary at all.
Figure 2. Click here for larger version.

The goal is to eliminate wasteful processes entirely, and minimize steps that may be necessary but don’t add value (Figure 2, at right). Going through this process allows you to focus on areas that add value, and facilitates easy fixes. It also allows you to optimize the sequence of longer and shorter term improvement projects, based on how they will affect the critical path.PhM: What do you do after mapping?A.H.: We perform a “SCOT” analysis, to determine “Strengths, Challenges, Opportunities and Threats,” involving all stakeholders in each process. This group’s work determines the five key areas that we focus on, and helps us develop a mission, goals and action plans. The mission, goals and action plans are updated every year, and each project’s goals are aligned to a formal charter so there are no “pet” projects.PhM: Apart from applying DMAIC and Lean, how did you focus your efforts?A.H.: Input from stakeholders, during the “SCOT” analysis, was critical in achieving focus. Corporate and division goals also shaped our strategy. As far as additional data are concerned, we interviewed employees, did a marketing survey, and examined customer requirements closely.PhM: How did you organize people within the group? Who is overseeing these efforts and who reports to whom?A.H.: We appointed a full-time Operational Excellence manager to tie projects to overall business needs and drive operational excellence throughout the culture. This manager is supported by a full-time black belt, who, in turn is supported by a master black belt who works full time developing tools, training and communications programs, and mentoring the black belts.We also appointed champions for each of our five key goal areas:
  1. New business;
  2. Operational excellence;
  3. State-of-the-art operations;
  4. Excellence in quality and compliance;
  5. Better connection with employees.
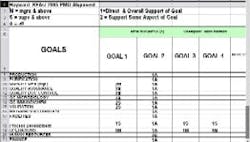
Each champion is accountable for the plans for each key area. These plans are executed by project teams.
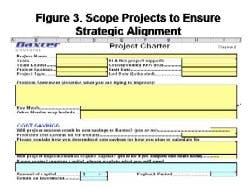
Figure 3. Click here for larger version.

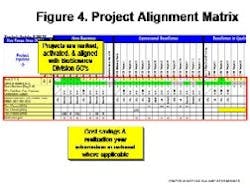
PhM: How do you translate goals into actions?A.H.: The key is aligning projects to strategic objectives and prioritizing projects based on available resources, as well as their potential contribution to plant success. At Hayward, we’ve developed a project alignment matrix (Figure 3, at right), grouping projects based on key focus area.We then rank the projects and align them with goals. Cost savings and other data can be entered when applicable (Figure 4, below). All employees are listed in this matrix, and flags assigned to each, and assignments are made based on functional area (Figure 5, below).We’ve also developed plant and developmental scorecards that measure results for each project based on how they addressed cost, customer, regulatory compliance and continuous improvement.PhM: Can you give some examples of results that you achieved through this Operational Excellence program?
Figure 4. Click here for larger version.

A.H.: In one case, we reduced the manufacturing cycle time of a monoclonal antibody gel. We realized that stabilizing cycle time would reduce the need for WIP and inventory at the plant.We analyzed the process to develop a better understanding on what was contributing to the longer cycle times.PhM: What did your analysis show?A.H.: Our prioritized list of sources for variation involved manufacturing scheduling and interdepartmental handoffs, external quality control lab testing cycle time, and exceptions. Roughly three quarters of batch review cycle time did not add value to product, and had a significant impact on bottom line results.PhM: How about on the shop floor?A.H.: We took a Lean Kaizen approach to reduce time wasted by interdepartmental handoffs during batch review. In the process, we discovered that much of the “pain” in the release process came from getting hold of supporting documentation, to release manufacturing protocols for the batch record. Many of the supporting documents came into QA only after the end of the entire manufacturing process. This created a windfall of documents during the release process.
Figure 5. Click here for larger version.


PhM: Did you implement any 5S or other programs to address this?A.H.: We divided the manufacturing process into intermediate product substeps and treated those as if they were “releasable product.” For making purified bulk, for example, substeps were seeding of bioreactors or inoculum, termination of bioreactors and purified bulk manufacture. We set targets of five days after each substep to turn in error-free manufacturing documents to QA, including time required for turn-backs and error correction, and 8 days for QA approval.Each substep was assigned a lot tracking sheet, containing three essential fields: master protocol name and number, date QA received, and Date QA approved.We did this for the convenience of the purification department which already used its own internal tracking system. We used this new tracking sheet to replace the older system, rather than giving operators yet another system to review.
Figure 6. Click here for larger version.

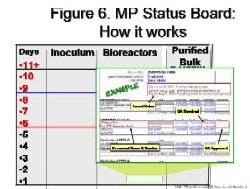
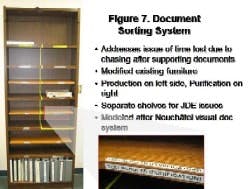
PhM: How about improving efficiency of document retrieval?A.H.: Workflow was also analyzed closely, and we found staff spent significant time searching for records, and traveling between departments.We established “Standard Work” procedures that documented the best way to perform a repeatable task consistently, and posted standard work instructions and boards describing the process near each relevant station. We also installed a master protocol (MP) Status Board (Figure 6, at right) so that everyone could easily view the progress of each batch’s documentation.We also developed a new document filing system (Figure 7, below) to systematically reduce the time employees took to retrieve documents. We dismantled a small shelf unit from a junk pile and salvaged its shelves to place in this taller shelf. We bought brackets and screws from Home Depot and a power drill from Facilities to put this together. Each area was labeled, and yellow tape run down the middle to separate documents for production and purification departments. The shelving system is used exclusively for manufacturing protocols (MPs) and the inspiration came from our Neuchatel facility.
Figure 7. Click here for larger version.

The MP board led to significant improvements in document approval cycle time. So far, all these efforts have combined to reduce document approval times from 31 to 7 days, and raise sigma quality level from 0.1 to 1.4For batch release, median variance in days, has fallen from 30 to -2, the process capability index has moved from -.4 to 0.45 and sigma quality level has gone from 0.3 to 2.3.Overall, the Kaizen efforts reduced distance staff spent traveling from work areas by 147 miles per year. It reduced batch review cycle time by 70%, and batch release cycle time by 50%. Visual management also improved communication. Everyone from operators to manager now knows the document review status of each lot.PhM: Are these efforts prerequisites to staying in business today?A.H.: At Baxter, we see them as the key to remaining competitive. And there’s plenty of evidence to support this view. Just look at the “Baldrige Index,” or the financial performance of companies that have won the Baldrige Award for quality. They’ve outperformed the Standard & Poor’s Index by a factor of up to six-fold, for the past several years. Operational Excellence is the key to business success, but corporate goals are only one part of the equation. These efforts ultimately require buy in from management and operations each day to succeed.